
 Lina Hope
The COVID-19 pandemic, which fundamentally reshaped the global landscape starting in early 2020, necessitated an unprecedented scale of data collection and policy implementation. For years, researchers, policymakers, and the general public relied on specialized trackers to navigate the complexities of infection rates, mortality, and the efficacy of government interventions. However, as the world transitions into a post-pandemic phase, the infrastructure supporting these critical resources is being decommissioned.
The recent decision to cease updates on the Policy Actions tracker serves as a poignant milestone. As the primary source for this data has stopped monitoring government responses to the virus, the era of real-time, granular tracking of COVID-19-era lockdowns and social measures has effectively drawn to a close. This shift marks not only the end of a logistical operation but also the beginning of an archival period where the data collected during these years will be scrutinized to inform future pandemic preparedness.
Main Facts: The Evolution of Pandemic Data Reporting
The tracking of COVID-19 was a collaborative, global effort that evolved significantly over three years. For the duration of the pandemic, the primary focus was twofold: epidemiological surveillance (cases and deaths) and policy monitoring (government responses).
As of March 7, 2023, the standard for epidemiological reporting shifted to the World Health Organization’s (WHO) Coronavirus (COVID-19) Dashboard. This transition occurred following the conclusion of the Johns Hopkins University (JHU) Coronavirus Resource Center’s reporting, which had been the gold standard for global tracking since the early days of the outbreak.
One critical clarification in the reporting methodology occurred as recently as March 18, 2024. Data analysts corrected existing datasets to reflect that reported figures represent new cases and deaths occurring over a full week, rather than a seven-day rolling average. This adjustment was essential to ensure that researchers looking back at the pandemic timeline possess an accurate understanding of the temporal distribution of infections and fatalities.
While trackers have limited their active windows—often displaying only the most recent 200 days to maintain system performance—the entirety of this historical data remains available through open-source repositories, such as the KFF GitHub page, ensuring that the legacy of the pandemic is preserved for future historical and scientific analysis.
A Chronology of Data Transparency
The timeline of COVID-19 data tracking reflects the rapid development of global health governance.
- Early 2020: The emergence of SARS-CoV-2 saw a chaotic but rapid mobilization of data aggregation, led by institutions like Johns Hopkins University. This phase was defined by decentralized reporting and the struggle to harmonize data across disparate national health systems.
- 2021–2022: As the pandemic matured, tracking efforts became more sophisticated. The Oxford Covid-19 Government Response Tracker (OxCGRT) became the definitive source for policy analysis, capturing the nuanced spectrum of lockdowns, mask mandates, and economic stimulus programs.
- March 2023: A significant transition period, characterized by the winding down of the JHU resource center and the consolidation of global reporting under the World Health Organization.
- Late 2023–2024: The cessation of policy-specific tracking. With the virus transitioning from a pandemic state to an endemic one in most of the world, governments shifted their focus from containment to long-term health management, rendering the intensive "policy tracker" model less relevant for current decision-making.
Supporting Data and Methodology
The reliability of pandemic data relies entirely on the rigor of the underlying methodology. The current datasets, which serve as the final record of the pandemic’s intensity, are built upon a foundation of international collaboration.
Epidemiological Data
The WHO’s current data streams are supplemented by population metrics from the United Nations World Population Prospects, specifically utilizing 2021 estimates to maintain consistency across comparative models. Income-level classifications are sourced from the World Bank, allowing researchers to analyze how COVID-19 impacted countries differently based on economic resources. Regional classifications follow the WHO’s geographic standards, providing a framework to understand the virus’s movement across borders.
Policy Data
The tracking of social distancing, economic support, and health systems was categorized into clear, measurable indicators:
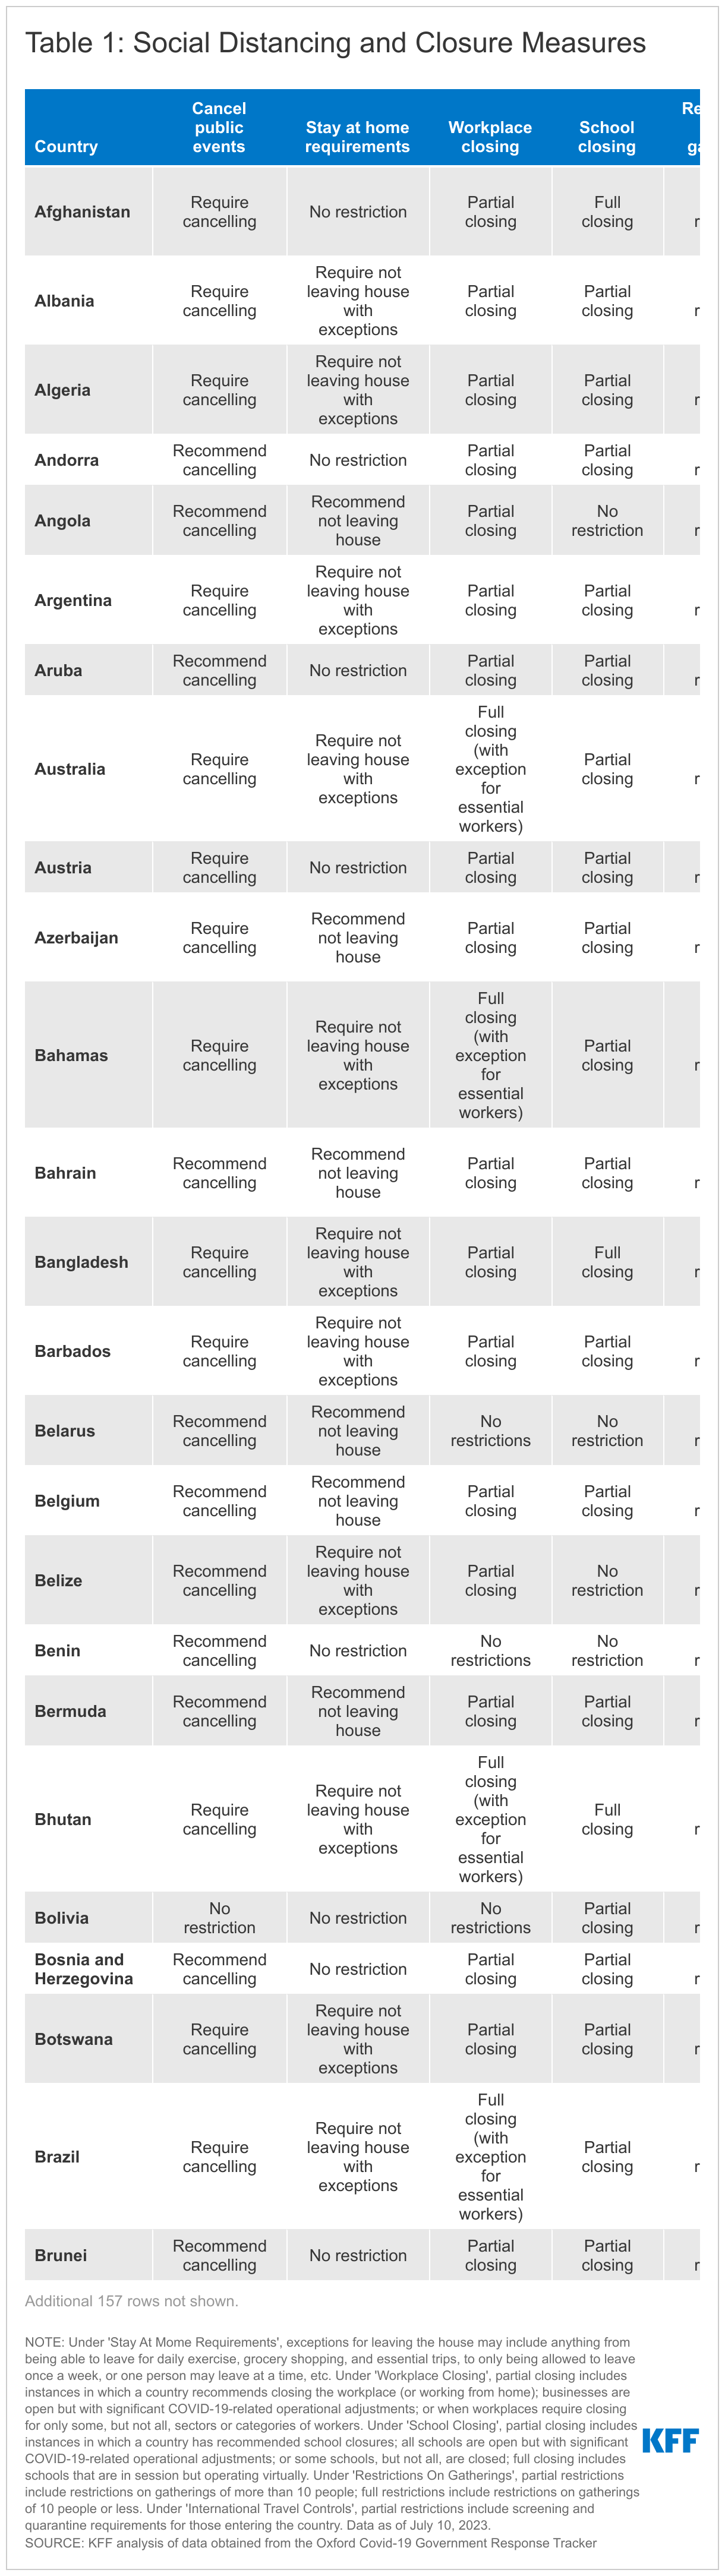
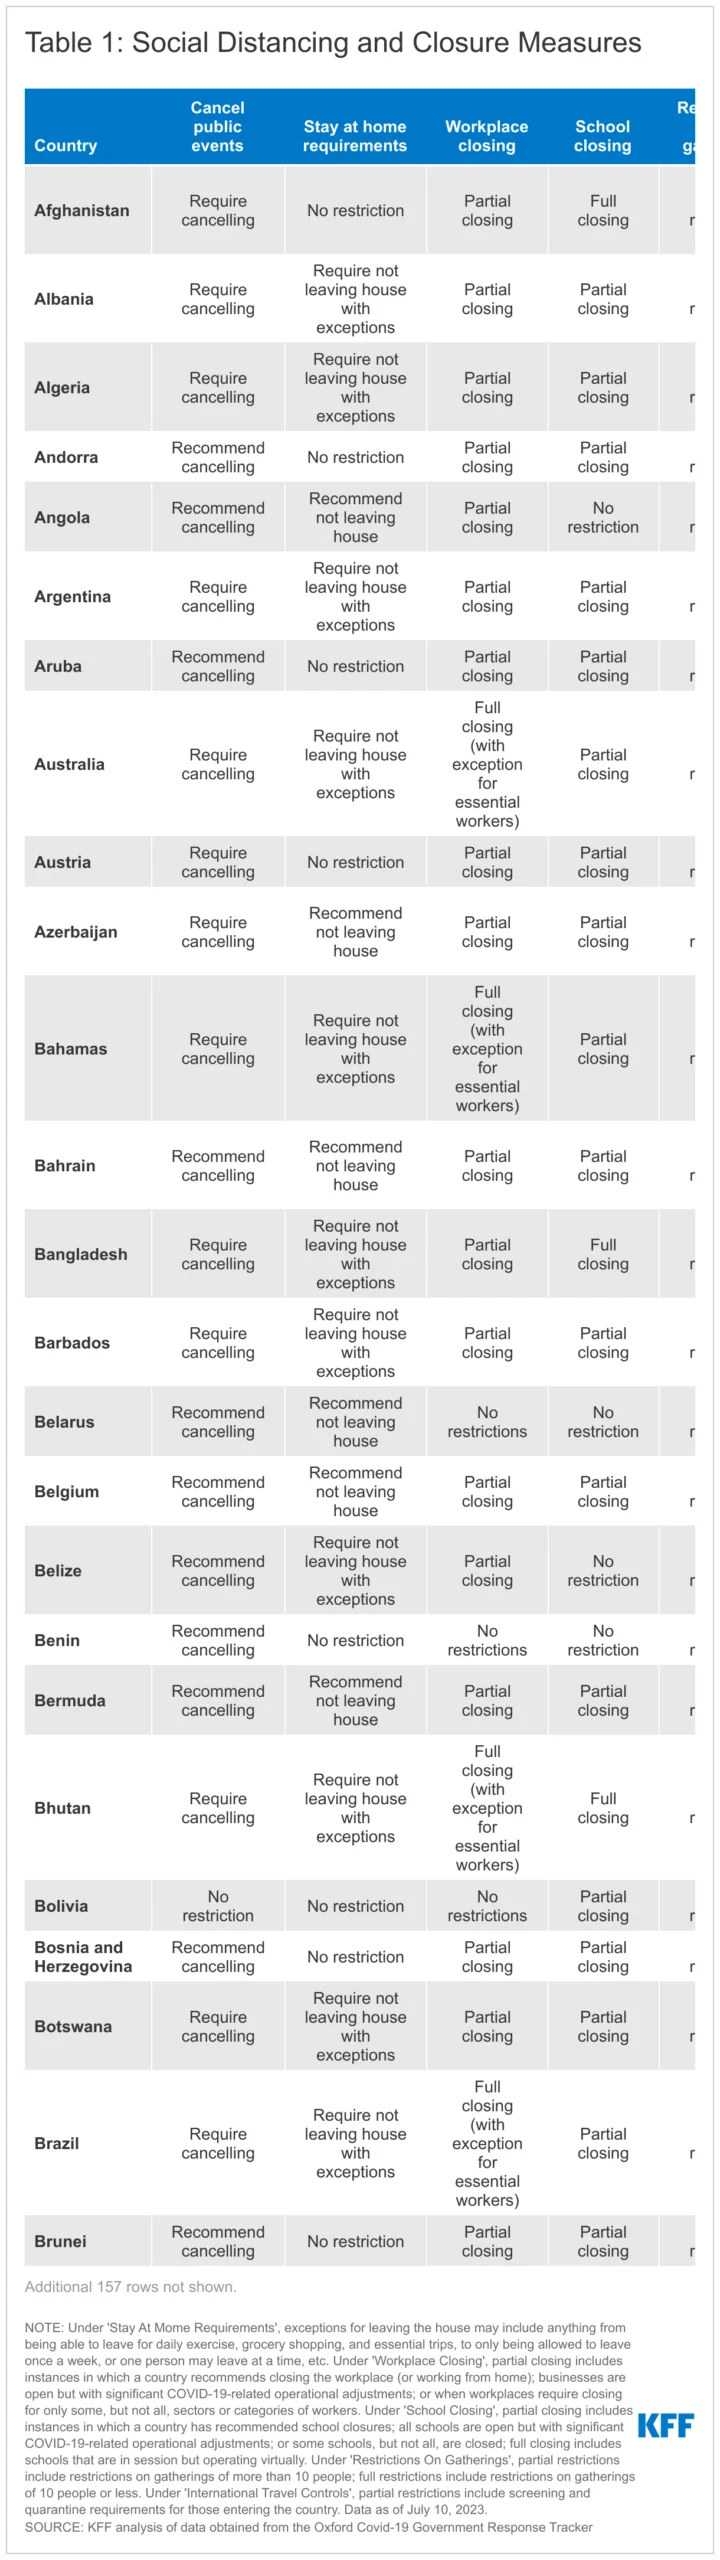
- Social Distancing and Closures: This tracked the spectrum of "stay-at-home" orders. The methodology accounted for varying levels of stringency, from total lockdowns to partial recommendations for school and workplace closures.
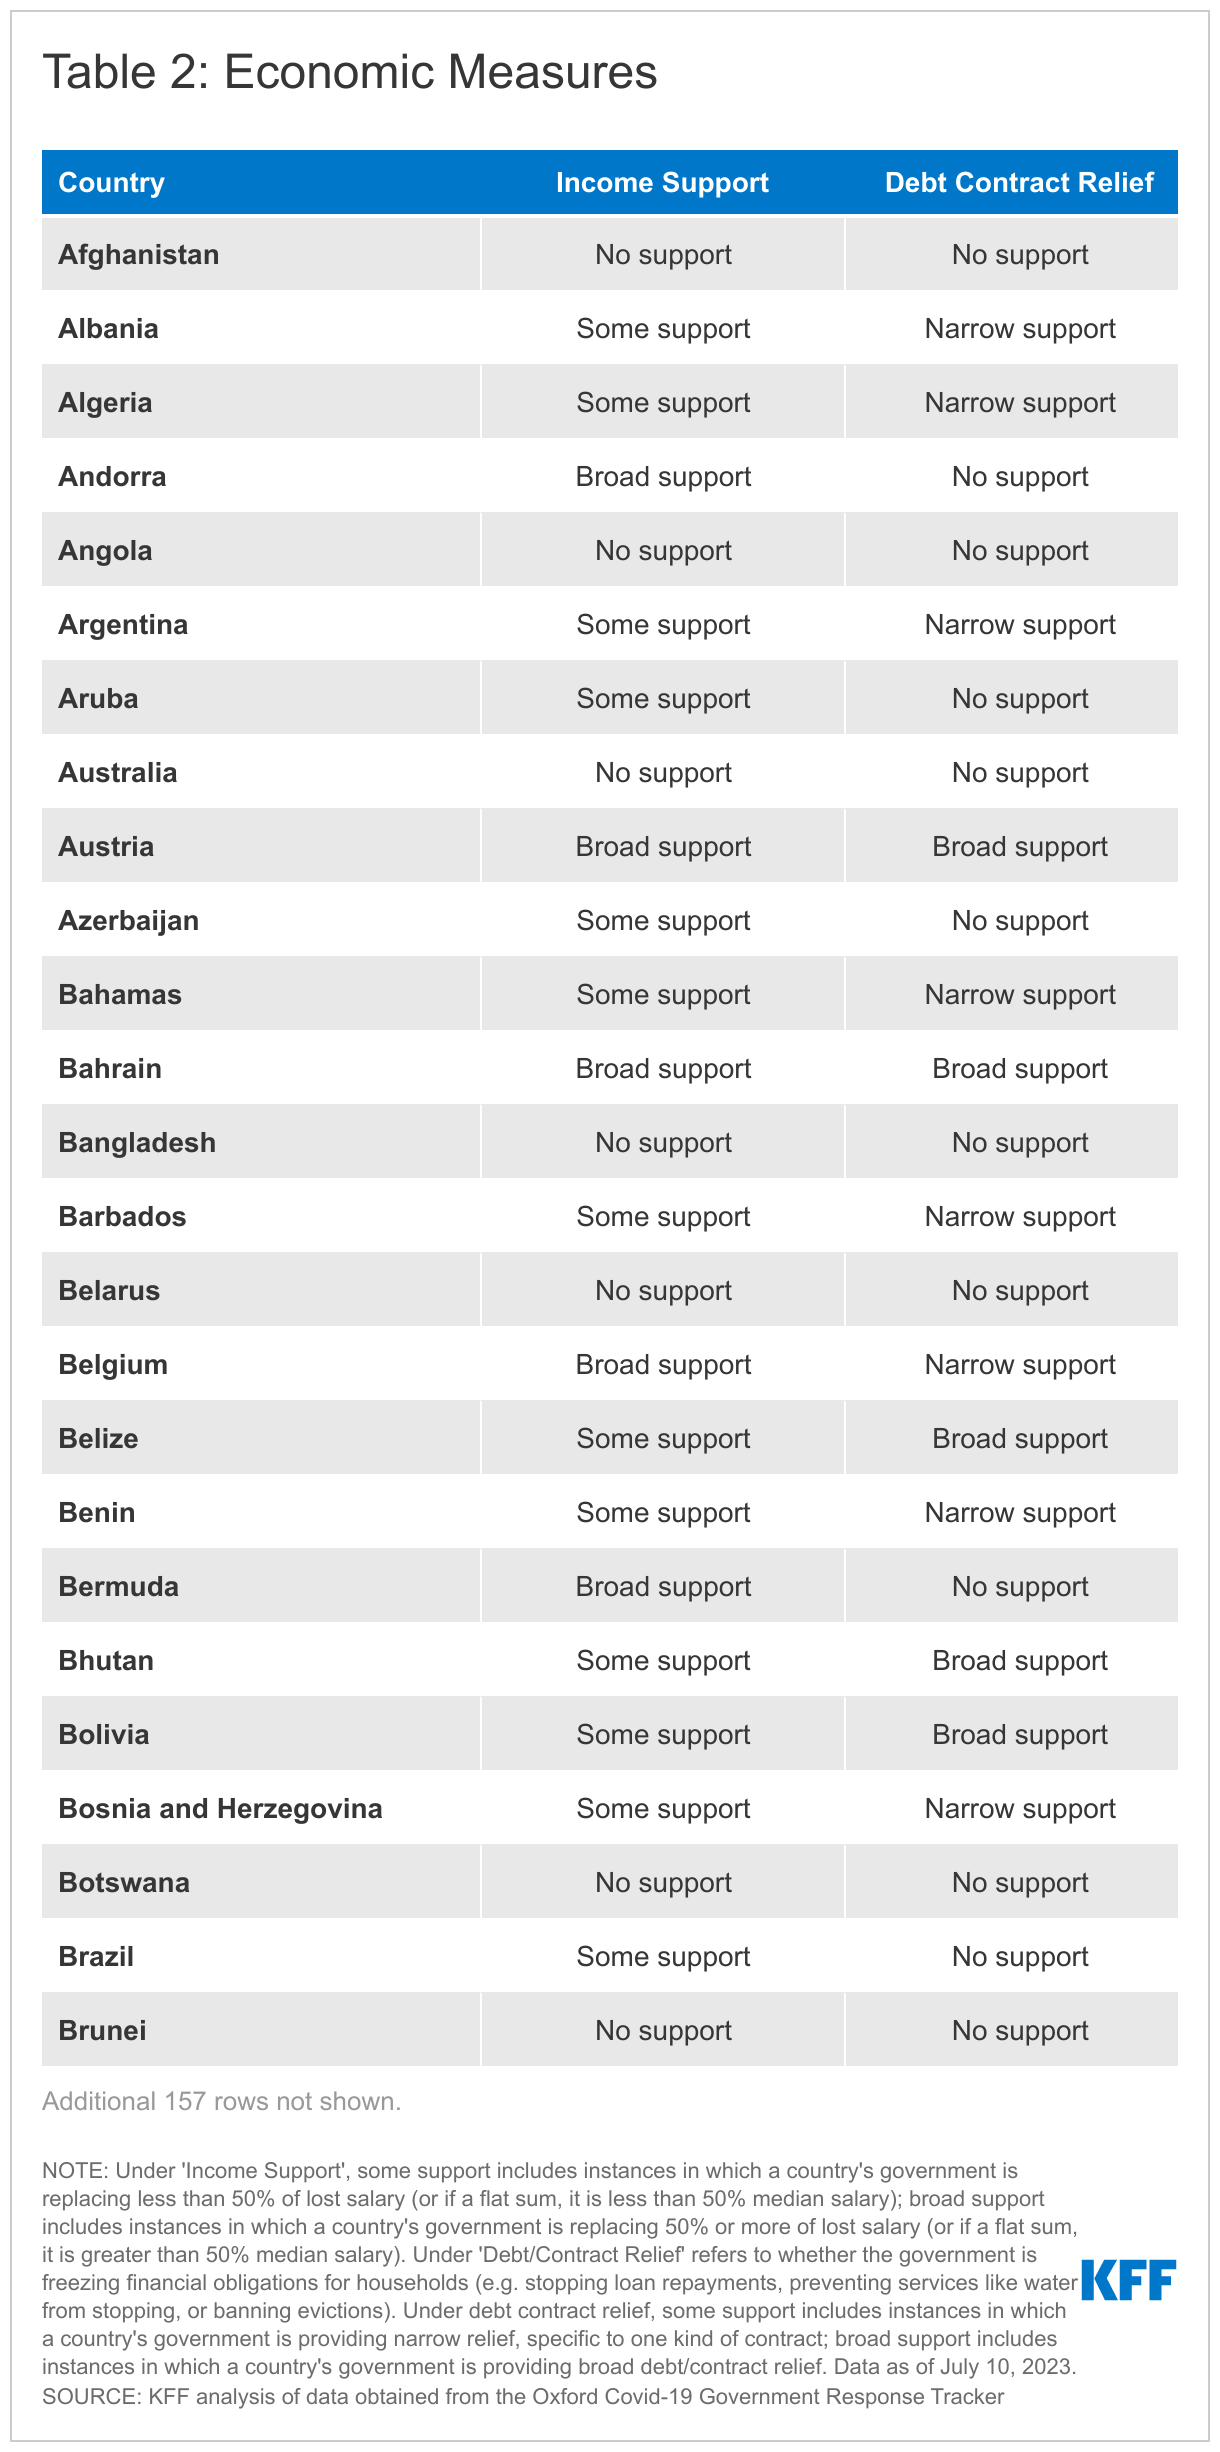
- Economic Measures: These categories measured the fiscal response of governments, including direct income support—defined as either narrow (replacing less than 50% of lost salary) or broad (50% or more)—and debt relief programs designed to mitigate the financial shock to households and businesses.
- Health Systems: This included the tracking of vaccine eligibility, which was coded based on whether priority groups (such as the elderly or essential workers) had specific access. Facial covering mandates were also tracked, distinguishing between simple recommendations and strict legal requirements.
Official Responses and Policy Shifts
The data collected by the Oxford Covid-19 Government Response Tracker reveals a complex tapestry of state intervention. Governments faced the dual challenge of suppressing a novel pathogen while attempting to preserve economic viability.
The policy categories identified reveal that government intervention was not monolithic. For instance, in the realm of international travel, "partial restrictions" became the standard for many nations, involving a combination of screening, quarantine requirements, and testing protocols. These measures were constantly adjusted in response to new variants, such as Delta and Omicron, demonstrating the adaptive nature of public health policy in the 21st century.
The tracking of "workplace closing" policies is particularly instructive. By categorizing policies into full or partial closures, analysts were able to measure the impact of remote work policies on the transmission of SARS-CoV-2. This data is now being used to evaluate the economic trade-offs of these decisions—a topic that will likely dominate public policy discourse for the next decade.
Implications for Future Pandemic Preparedness
The decision to end the Policy Actions tracker is not a sign of negligence, but rather a reflection of the "end" of the emergency phase of the pandemic. However, the implications of this data transition are significant for future global health security.
The Institutional Memory of Data
The decommissioning of these trackers poses a risk of "data amnesia." Without active updates, the specific nuances of regional policy responses could be lost to time. It is incumbent upon international bodies to ensure that the archived datasets, particularly those housed on GitHub and through the WHO, remain accessible and interpretable for researchers who will, inevitably, conduct retrospective studies on which policies were most effective at saving lives without causing undue societal harm.
Standardizing Future Response
The methodology used to track policy actions—the codification of vague mandates into measurable units—provides a blueprint for future crises. By creating a standardized language for "social distancing" or "income support," the global health community has gained a tool to compare the efficacy of different government responses across diverse cultures and economic systems. Future pandemic preparedness plans must incorporate these tracking frameworks from day one, rather than building them in the midst of a crisis.
The Role of Transparency
The two-week lag in reporting observed in the current tracker highlights the persistent challenge of data latency. In a future pandemic, the goal must be to reduce this window. The shift to a weekly reporting cycle, while sustainable for an endemic virus, would be insufficient for a rapid-moving outbreak. The lessons learned from the transition from JHU to the WHO emphasize the importance of having redundant, interoperable systems that can hand off data responsibilities without gaps in continuity.
Conclusion
The COVID-19 pandemic acted as an accelerant for data science in public health. The trackers that documented the rise and fall of infection waves and the ebb and flow of government mandates have provided the world with an invaluable historical record. As we look back at these charts and tables, we see more than just numbers; we see the story of a global population attempting to coordinate its survival.
While the Policy Actions tracker is no longer being updated, the data it gathered remains a vital resource. It stands as a testament to the transparency required in modern governance and serves as a roadmap for the future. As we move forward, the challenge will be to maintain the spirit of global data cooperation that emerged during our darkest months, ensuring that when the next health crisis inevitably arrives, we are not just reacting, but responding with the benefit of the wisdom gained from the past.


 Nila Kartika Wati
 Neng Nana