
 Pevita Pearce
Introduction: The Changing Landscape of Global Health Monitoring
In the wake of the most significant public health crisis in a century, the global community has relied heavily on data transparency to navigate the complexities of the COVID-19 pandemic. From the early, frantic days of tracking infection clusters to the sophisticated modeling of vaccine rollout efficacy, data has been the bedrock of public policy. However, as the world transitions into a post-emergency phase, the infrastructures that supported this unprecedented level of global information sharing are undergoing significant changes.
This report examines the status of the leading COVID-19 tracking initiatives, specifically noting the cessation of government policy response tracking and the transition of morbidity and mortality reporting to the World Health Organization (WHO). As these trackers pivot or retire, it is essential to understand the methodologies, the data sources, and the implications for future public health preparedness.
The Main Facts: A Shift in Data Stewardship
The tracking of COVID-19 metrics has undergone two major shifts in the last two years. First, the primary source for case and death data transitioned from the Johns Hopkins University (JHU) Coronavirus Resource Center to the World Health Organization (WHO) as of March 7, 2023. This change marked the end of an era for the JHU dashboard, which had served as the gold standard for real-time pandemic visualization since the earliest days of the outbreak in 2020.
Furthermore, a significant component of the global response record—the Policy Actions tracker—has officially ceased updates. This data, which previously provided granular insights into how governments implemented social distancing, economic support, and health system interventions, is no longer being maintained because the underlying source, the Oxford Covid-19 Government Response Tracker (OxCGRT), has concluded its active monitoring of government policy responses.
Key takeaways for researchers and policy analysts include:

- Data Lag: Users must account for a standard two-week reporting lag in official figures.
- Reporting Clarification: As of March 18, 2024, data sets were corrected to ensure that figures represent total new cases and deaths over a full seven-day period, rather than a daily average.
- Accessibility: While current trackers are limited to the most recent 200 days to optimize performance and load times, comprehensive historical data sets remain available via public repositories such as GitHub.
Chronology: The Timeline of Tracking
The history of COVID-19 data collection is a study in rapid, global mobilization.
- 2020-2022: The Era of Real-Time Crisis Mapping. During the height of the pandemic, organizations like Johns Hopkins University and the Oxford Blavatnik School of Government created decentralized yet cohesive frameworks to track the virus’s movement and the corresponding state responses. These tools allowed for cross-country comparisons that shaped international lockdowns, travel restrictions, and vaccine distribution strategies.
- March 10, 2023: The Closure of the JHU Dashboard. The JHU Resource Center, a beacon of transparency for researchers and the general public, officially ended its mapping operations, signaling a formal transition toward institutional, state-run data reporting handled primarily by the WHO.
- 2023-2024: The Gradual Sunset of Policy Tracking. As the pandemic moved from an emergency phase to an endemic state, the necessity for daily updates on policy mandates—such as social distancing, mask mandates, and international travel controls—diminished. Consequently, the Oxford tracker ceased its active data collection, leaving a static, historical record of government intervention.
Supporting Data: Methodology and Metrics
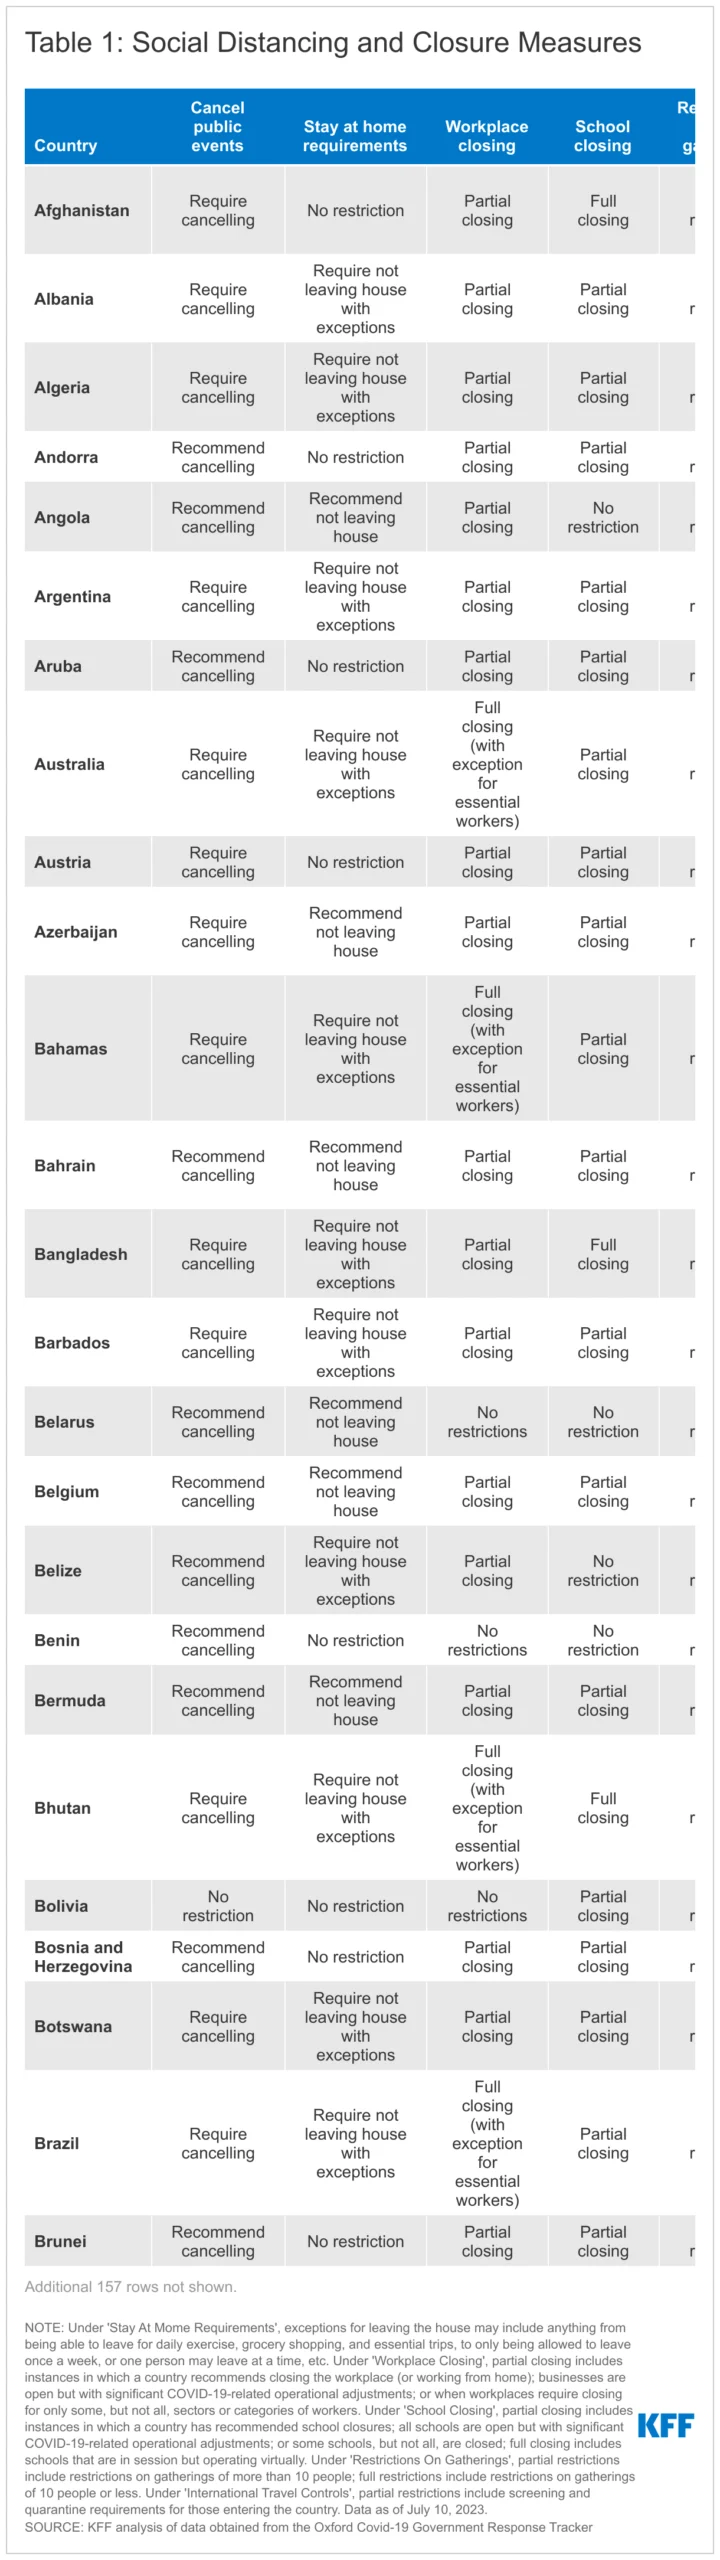
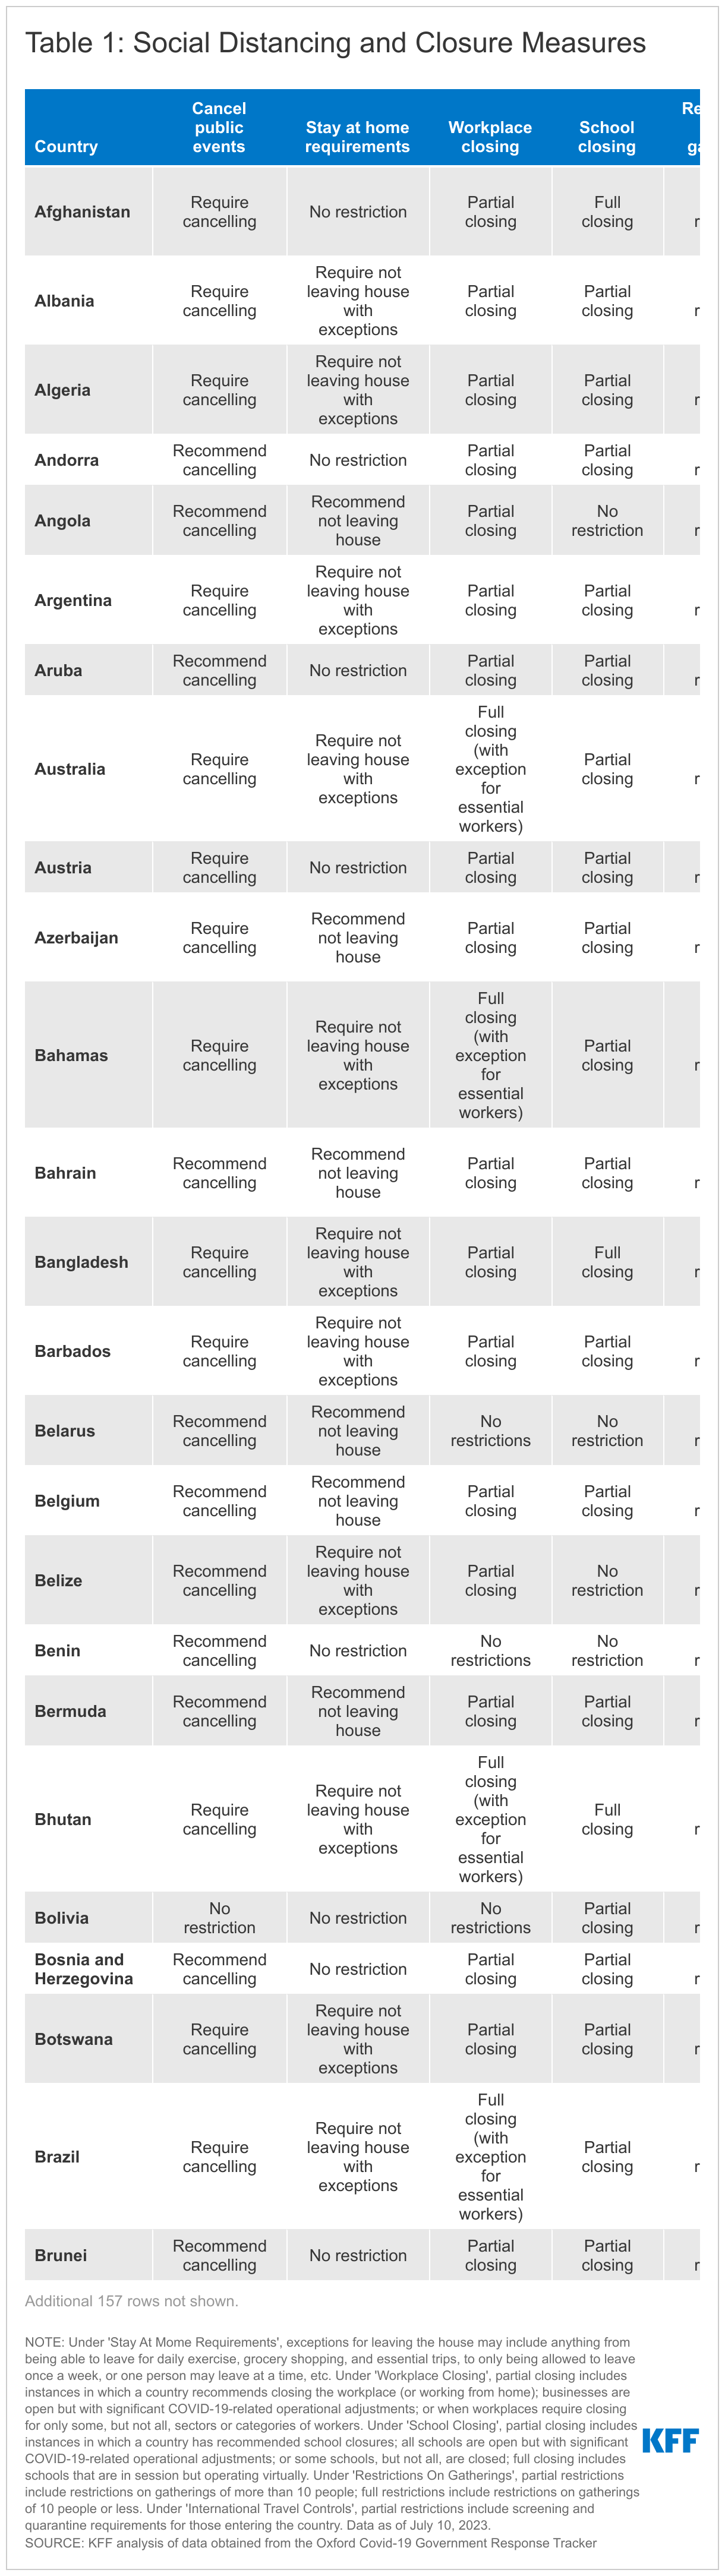
Understanding the data requires a rigorous look at how these metrics were defined and aggregated. The reporting structure was divided into three core pillars: Social Distancing/Closures, Economic Measures, and Health Systems Measures.
1. Social Distancing and Closure Measures
This category tracked the severity of government intervention. "Stay-at-home" requirements were coded based on the stringency of exceptions, ranging from unrestricted movement to strict lockdowns where only one person per household could exit for essential needs. "School closings" were categorized by the degree of disruption, identifying the difference between full physical closures and shifts to virtual instruction or hybrid operational models.
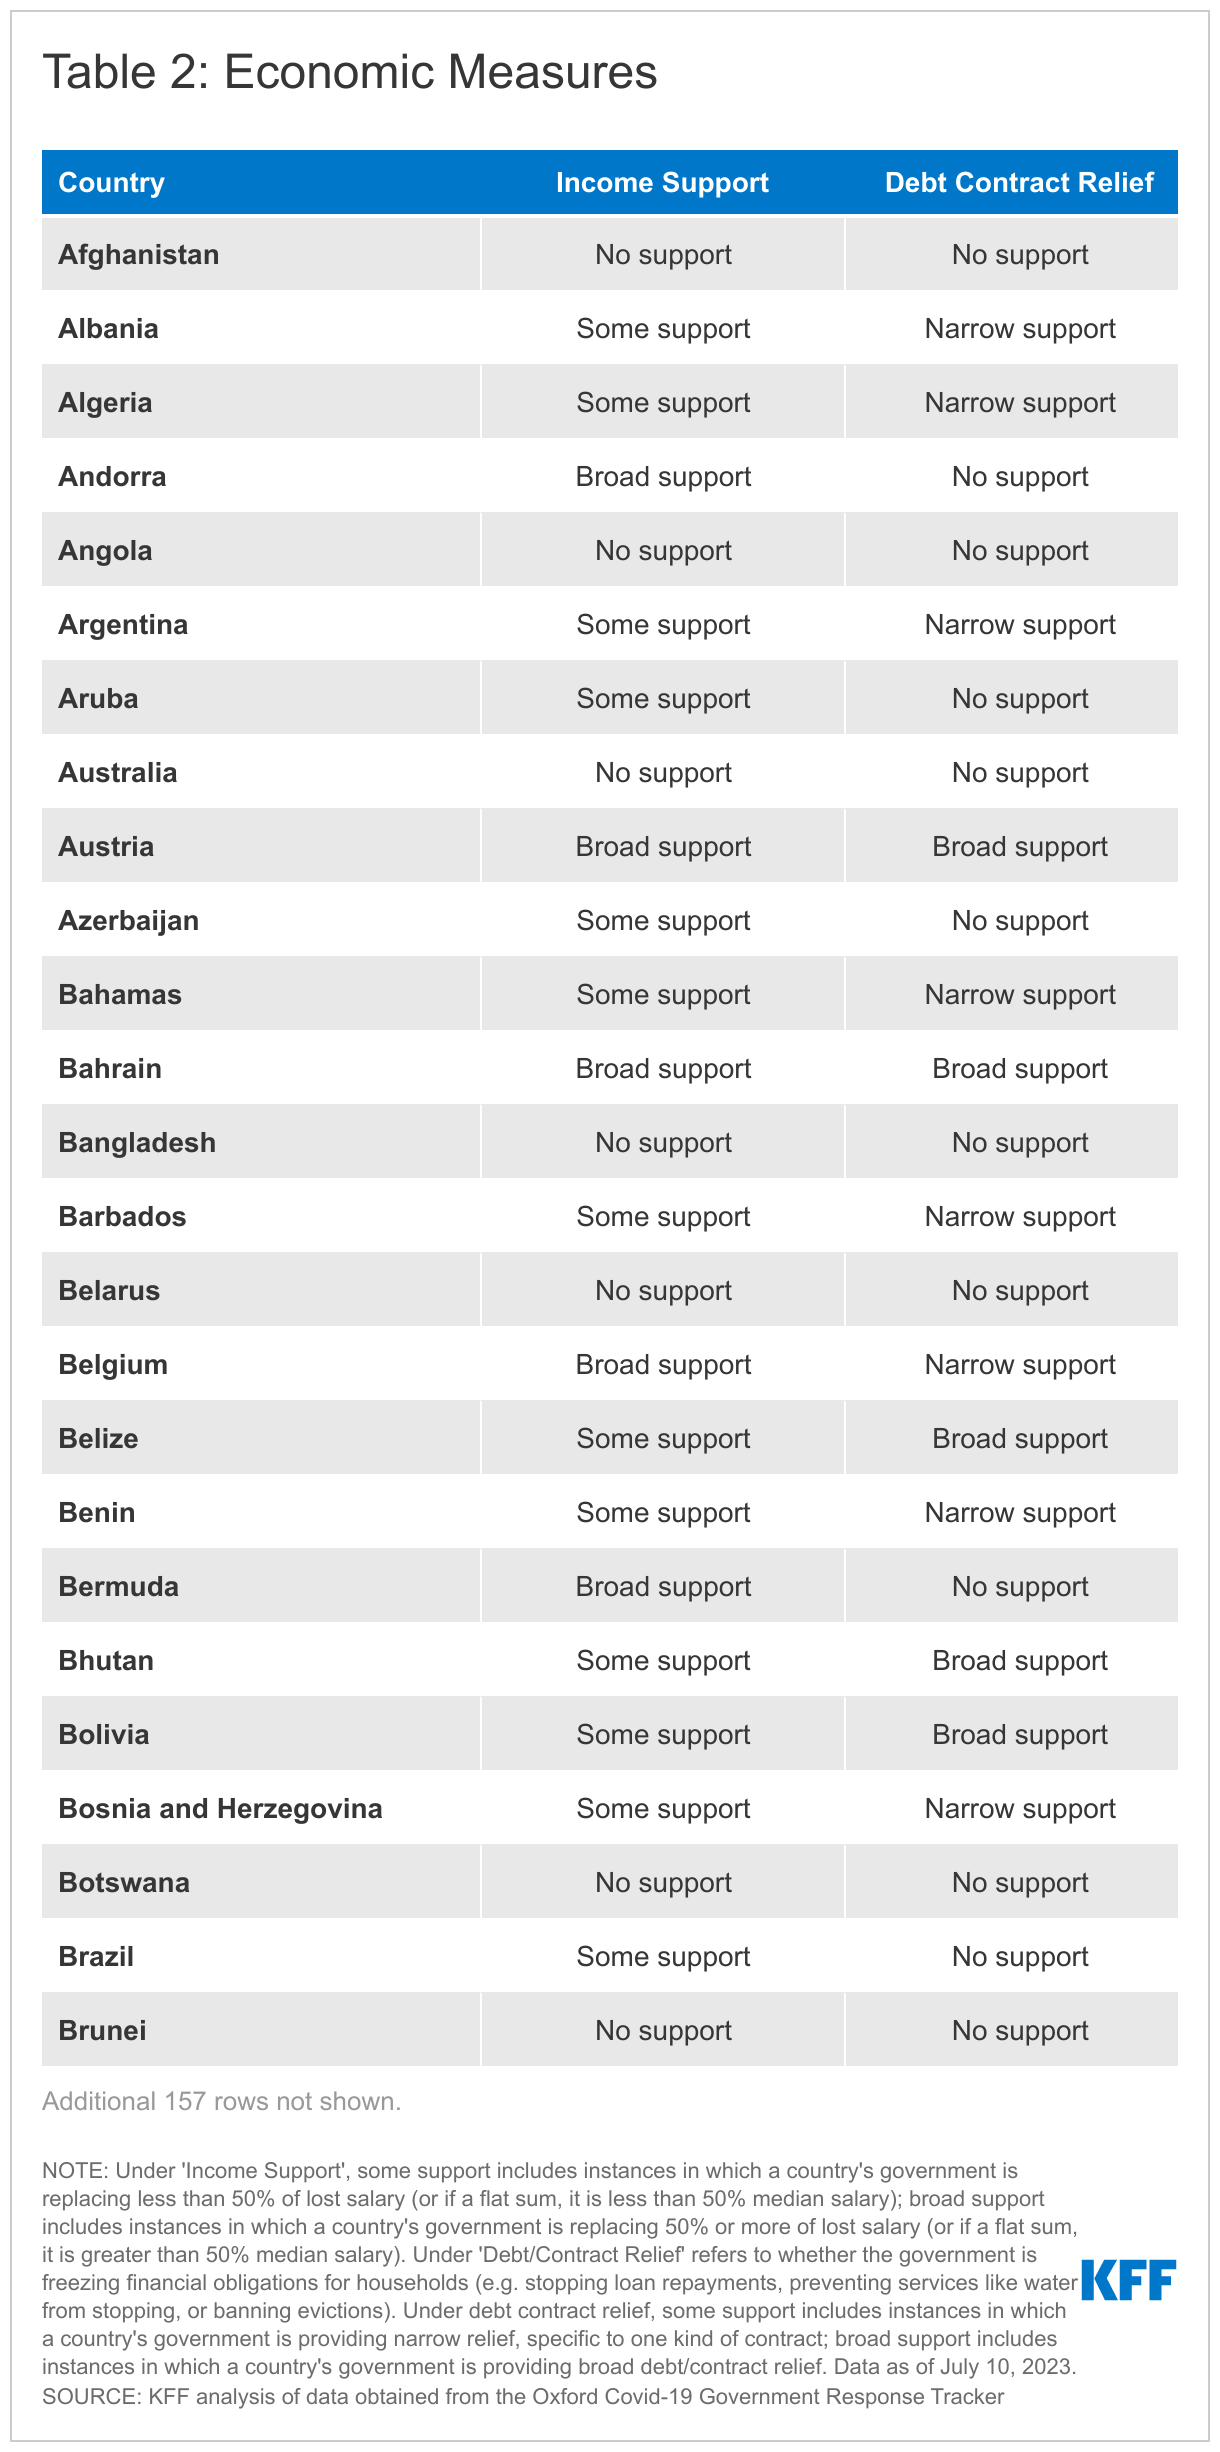
2. Economic Measures
Economic resilience during the pandemic was measured through two primary indicators:
- Income Support: Categorized as "narrow" (replacing less than 50% of lost wages) or "broad" (replacing 50% or more).
- Debt/Contract Relief: Tracked as specific interventions by governments to prevent mass defaults or business collapses during periods of enforced inactivity.
3. Health Systems Measures
The health system component focused on capacity and preventative access. This included the rollout of vaccines—differentiated by eligibility cohorts such as the elderly, clinical vulnerabilities, and essential workers—and the mandate of facial coverings. The "Facial Covering" metric tracked whether masks were merely recommended, required in specific high-risk scenarios, or mandatory in all public settings.
Official Responses: The Role of Global Institutions
The reliance on the Oxford Covid-19 Government Response Tracker (OxCGRT) was fundamental to the global policy analysis community. By standardizing diverse policy languages—from "partial lockdown" to "essential business closure"—the OxCGRT provided a common vocabulary for comparing the effectiveness of different national strategies.
With this resource now static, the onus of policy analysis shifts from active tracking to historical meta-analysis. For those interested in how specific policies influenced infection rates, the Oxford team’s codebooks and interpretation guides remain the definitive resources for understanding the nuances of the data. Researchers are encouraged to reference the Oxford repository for the full context of how government mandates evolved across different socio-economic and geographic regions.
Implications: Looking Toward Future Preparedness
The retirement of these trackers serves as a critical milestone in the history of the COVID-19 pandemic. However, the legacy of this data collection remains profound.
The "Data Debt" of the Pandemic
The move to stop tracking policy responses does not mean the work of analysis is over; rather, it transitions into a phase of longitudinal research. Scientists are currently using the data collected between 2020 and 2022 to conduct "post-mortems" on the efficacy of various interventions. For example, did countries with early, broad income support experience better long-term economic recovery than those with narrow support? Did school closures correlate linearly with the reduction of transmission in specific demographic clusters?
Transparency and Public Trust
The shift from academic-led tracking (like JHU) to official intergovernmental reporting (WHO) underscores a transition in the public’s relationship with health data. While institutional data provides a more "official" record, the decentralized, open-source nature of the previous trackers fostered a unique level of trust and accessibility. Future health crises will require a hybrid model that maintains this level of transparency while ensuring long-term sustainability.
Lessons for Future Pandemics
The primary lesson learned from the lifecycle of these trackers is the importance of interoperability. As the WHO continues to curate global health data, the integration of demographic, economic, and epidemiological data remains the biggest challenge. The 2024 correction regarding "weekly versus daily" reporting highlights the fragility of large-scale data aggregation—even a minor nomenclature error can significantly alter the interpretation of trends.
In the future, global health agencies must invest in standardized reporting protocols from the outset to avoid the "two-week lag" and "definition drift" that characterized much of the COVID-19 monitoring period.
Conclusion
The cessation of active COVID-19 policy tracking and the consolidation of morbidity statistics under the WHO mark the end of the pandemic’s emergency-response phase. While the trackers themselves are evolving, the vast data sets generated over the last several years will continue to serve as a vital resource for public health researchers, historians, and policymakers. By maintaining access to these archives via repositories like GitHub and the WHO Dashboard, the global community ensures that the lessons learned at such a high cost are not lost to history, but are instead used to build a more resilient and responsive global health infrastructure for the future.


 Nila Kartika Wati

 Neng Nana